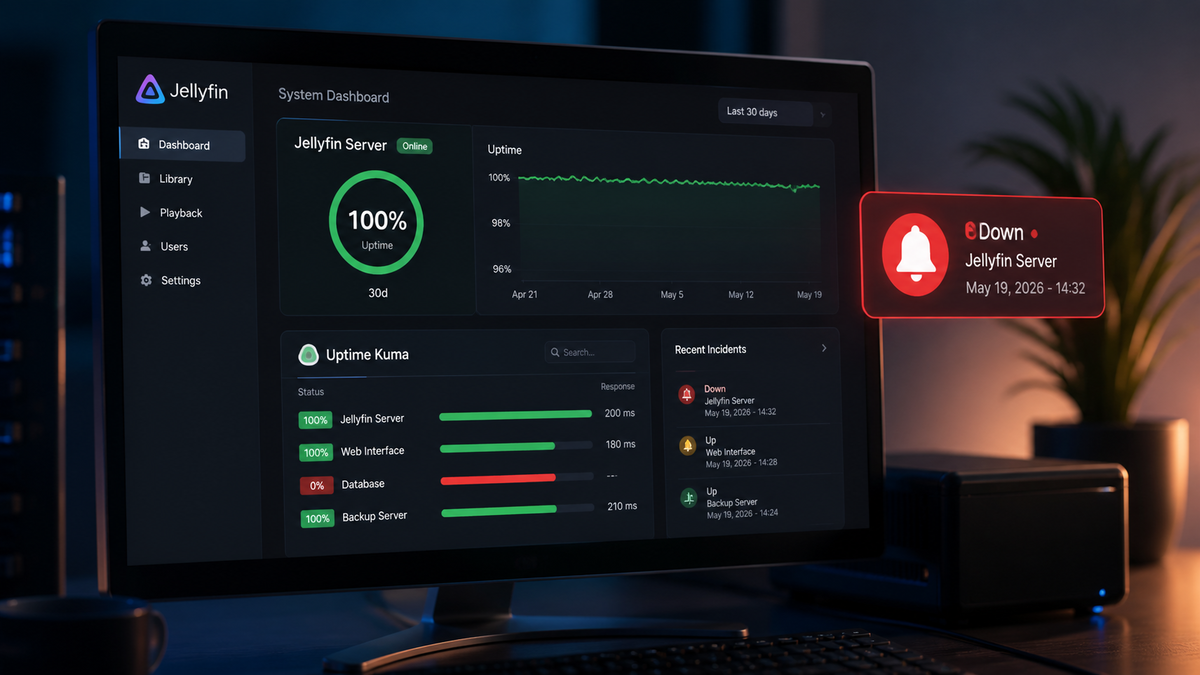
Monitor Jellyfin Server Uptime with Uptime Kuma: Setup, Alerts, and Dashboard (2026)
Your Jellyfin server crashed at 3 AM. Nobody noticed until your partner tried to watch a movie the next evening. By then, the database had been down for 18 hours and you missed a Radarr import.
Uptime Kuma prevents this. It checks your Jellyfin server every 30 seconds and sends you an instant notification the moment something goes wrong. It is the most popular self-hosted monitoring tool in the homelab community in 2026, with over 75,000 GitHub stars.
This guide covers the full setup: Docker deployment, Jellyfin health monitoring, alert configuration, and building a status page.
What Is Uptime Kuma?
Uptime Kuma is a self-hosted monitoring tool that:
- Checks if your services are responding (HTTP, TCP, DNS, Docker, and more)
- Sends instant notifications when a service goes down or comes back up
- Tracks uptime history with response time graphs
- Provides a public or private status page
- Supports 90+ notification providers (Discord, Telegram, Ntfy, Slack, email, Pushover, and more)
It runs as a single Docker container with a clean web UI. No agents, no configuration files, no external dependencies.
Step 1: Deploy Uptime Kuma with Docker
services:
  uptime-kuma:
    image: louislam/uptime-kuma:1
    container_name: uptime-kuma
    volumes:
      - ./uptime-kuma/data:/app/data
    ports:
      - 3001:3001
    restart: unless-stopped
docker compose up -d
Open http://your-server:3001 and create your admin account.
Step 2: Add Jellyfin as a Monitor
Jellyfin exposes a /health endpoint that returns HTTP 200 when the server is running and the database is accessible.
Configure the monitor
- In Uptime Kuma, click Add New Monitor
- Configure:
| Setting | Value |
|---|---|
| Monitor Type | HTTP(s) |
| Friendly Name | Jellyfin |
| URL | http://jellyfin:8096/health |
| Heartbeat Interval | 30 seconds |
| Retries | 3 |
| Accepted Status Codes | 200 |
- Click Save
Uptime Kuma immediately starts checking your Jellyfin server every 30 seconds. The dashboard shows a green badge when healthy and a red badge when down.
Why use /health instead of the main page?
The /health endpoint verifies both HTTP connectivity and database access. If the Jellyfin web UI loads but the database is corrupted, /health returns an error while the main page might still partially render.
Step 3: Monitor Your Entire Media Stack
Do not stop at Jellyfin. Add monitors for every service in your stack:
| Service | URL | Type |
|---|---|---|
| Jellyfin | http://jellyfin:8096/health | HTTP(s) |
| Radarr | http://radarr:7878/ping | HTTP(s) |
| Sonarr | http://sonarr:8989/ping | HTTP(s) |
| Prowlarr | http://prowlarr:9696/ping | HTTP(s) |
| Seerr | http://seerr:5055/api/v1/status | HTTP(s) |
| Bazarr | http://bazarr:6767/api/system/health | HTTP(s) |
| qBittorrent | http://qbittorrent:8080 | HTTP(s) |
| Caddy | https://jellyfin.yourdomain.com | HTTP(s) |
For Docker-based services, use the Docker container name as the hostname (if Uptime Kuma is on the same Docker network).
Docker Container Monitoring
Uptime Kuma can also monitor Docker containers directly:
- Mount the Docker socket:
services:
  uptime-kuma:
    image: louislam/uptime-kuma:1
    volumes:
      - ./uptime-kuma/data:/app/data
      - /var/run/docker.sock:/var/run/docker.sock:ro
    ports:
      - 3001:3001
    restart: unless-stopped
- Add a monitor with type Docker Container
- Select the container name (e.g.,
jellyfin) - Uptime Kuma checks if the container is running, not just if the port responds
This catches scenarios where the container is running but the application inside has crashed.
Step 4: Configure Notifications
Uptime Kuma supports 90+ notification providers. Here are the most popular for homelab admins:
Discord
- In your Discord server, create a webhook: Server Settings, Integrations, Webhooks, New Webhook
- Copy the webhook URL
- In Uptime Kuma: Settings, Notifications, Setup Notification, select Discord
- Paste the webhook URL
- Test and save
You receive a Discord message the moment Jellyfin goes down, and another when it comes back up.
Telegram
- Create a bot via @BotFather on Telegram
- Get your chat ID from @userinfobot
- In Uptime Kuma: select Telegram, enter bot token and chat ID
- Test and save
Ntfy (Self-Hosted)
If you run Ntfy alongside your media stack:
- In Uptime Kuma: select Ntfy
- Server URL:
http://ntfy:80 - Topic:
jellyfin-alerts - Test and save
Subscribe to the topic on your phone via the Ntfy Android app.
Email (SMTP)
For email alerts, configure your SMTP server (Gmail, Mailgun, or self-hosted):
- Select SMTP
- Enter SMTP host, port, username, password
- Set sender and recipient addresses
- Test and save
Step 5: Build a Status Page
Uptime Kuma includes a built-in status page that you can share with your users.
Create the status page
- In Uptime Kuma, click Status Pages in the sidebar
- Click New Status Page
- Name it (e.g., "MyServer Status")
- Add your monitors to the page
- Customize the description and incident history
Share with users
The status page is accessible at http://your-server:3001/status/your-page-slug.
If you use a reverse proxy, expose it at a clean URL like status.yourdomain.com.
Caddyfile:
status.yourdomain.com {
    reverse_proxy uptime-kuma:3001
}
Now when a user asks "is the server down?", you can point them to the status page instead of checking manually.
Step 6: Advanced Monitoring
Response Time Tracking
Uptime Kuma logs the response time of every health check. Over time, you can see trends:
- Normal: Jellyfin
/healthresponds in 50-200ms - Slow: 500ms+ indicates database pressure or disk I/O issues
- Timeout: the server is overloaded or down
A gradual increase in response time often predicts a crash before it happens.
Certificate Expiry Monitoring
If you use HTTPS with Let's Encrypt, Uptime Kuma automatically tracks your SSL certificate expiry and alerts you before it expires.
Add an HTTPS monitor for https://jellyfin.yourdomain.com and enable certificate expiry notifications (default: 30 days before expiry).
Keyword Monitoring
For more sophisticated checks, use the HTTP(s) - Keyword monitor type:
- URL:
http://jellyfin:8096/System/Info - Expected keyword:
"OperatingSystem" - This verifies that Jellyfin is not just responding but returning valid API data
Uptime Kuma vs JellyWatch: Complementary Tools
Uptime Kuma and JellyWatch solve different problems:
| Feature | Uptime Kuma | JellyWatch |
|---|---|---|
| Purpose | Is the server up or down? | What is happening on the server right now? |
| Monitoring type | Availability (up/down) | Activity (sessions, transcoding, CPU) |
| Alert trigger | Server unreachable | New session, CPU spike, device connected |
| Historical data | Uptime percentage, response time | Viewing history, watch statistics |
| Status page | Yes (shareable) | No |
| Platform | Web (self-hosted) | Android (native app) |
| Arr stack integration | Basic (HTTP checks) | Deep (Radarr/Sonarr/Seerr management) |
Use both together:
- Uptime Kuma tells you the server is down at 3 AM and sends a Discord alert
- JellyWatch tells you why it went down (CPU spike from a runaway transcode) and lets you manage the recovery from your phone
Notification Strategy for Homelab Admins
Not every alert deserves the same urgency:
| Event | Notification channel | Priority |
|---|---|---|
| Jellyfin down | Discord + Telegram + Push | High |
| Radarr/Sonarr down | Discord only | Medium |
| SSL certificate expiring | Email (weekly digest) | Low |
| Response time degraded | Discord only | Medium |
| Jellyfin recovered | Discord + Telegram | Info |
Configure different notification groups in Uptime Kuma for different severity levels.
Maintenance Windows
When you plan to update your server, set a maintenance window in Uptime Kuma to suppress false alerts:
- Click on the Jellyfin monitor
- Click Maintenance
- Set the start and end time
- During maintenance, Uptime Kuma pauses alerts but continues logging
This prevents your Discord from blowing up during a planned docker compose pull && docker compose up -d.
Performance Impact
Uptime Kuma is extremely lightweight:
- RAM: ~70-100 MB
- CPU: negligible (periodic HTTP requests)
- Disk: ~50 MB for the application + logs
It runs comfortably alongside your entire media stack on any hardware, including an Intel N100 mini PC.
FAQ
Does Uptime Kuma work with Emby? Yes. Emby exposes a similar health endpoint. Use http://emby:8096/System/Info/Public as the monitor URL.
Can Uptime Kuma restart a crashed container? Not directly. Uptime Kuma is a monitoring tool, not an orchestrator. Use Docker's restart: unless-stopped policy for automatic container restarts. Uptime Kuma alerts you when the restart happens.
How many monitors can Uptime Kuma handle? Hundreds. The tool is designed for monitoring dozens of services simultaneously with minimal resource usage.
Is Uptime Kuma better than Grafana for Jellyfin monitoring? Different tools for different jobs. Uptime Kuma excels at simple up/down monitoring with instant alerts. Grafana excels at detailed metrics visualization with historical graphs. Many admins run both.
Can I monitor Jellyfin from outside my network? Yes. If your Jellyfin server is accessible via a public URL (reverse proxy, Cloudflare Tunnel), point Uptime Kuma at the public URL. You can also run Uptime Kuma on a separate VPS for true external monitoring.
Does Uptime Kuma support mobile push notifications? Not natively. Use Ntfy, Pushover, or Telegram as the notification provider to get push notifications on your phone.
Uptime Kuma watches the heartbeat. JellyWatch watches the sessions. Download JellyWatch on Google Play - real-time session monitoring, transcoding diagnostics, and push alerts that complement Uptime Kuma perfectly.
On Emby? Download EmbyWatch on Google Play - the same deep monitoring experience for Emby servers.

Comments
No comments yet. Be the first to share your thoughts.
Leave a comment